Who Pays State Personal Income Tax?
While the most current complete tax data from the Franchise Tax Board is for 2013, the recently published zip code data enables some preliminary analysis for the 2014 receipts.
Based on this data, taxpayers filing from a California address paid an additional $9.7 billion in personal income tax (PIT) in 2014, or a 17.3% increase over 2013.
By region, 40.3% of PIT revenues came from the Bay Area. More importantly, 51.2% of the increased PIT revenues in 2014 came from this region, once again illustrating how much California is reliant on a single region not only for continued jobs and employment growth, but the continued health of the state’s fiscal situation. Los Angeles, with 30% of the population, was the next largest region, paying 27.5% of total PIT and a 25.5% share of the increased PIT receipts.
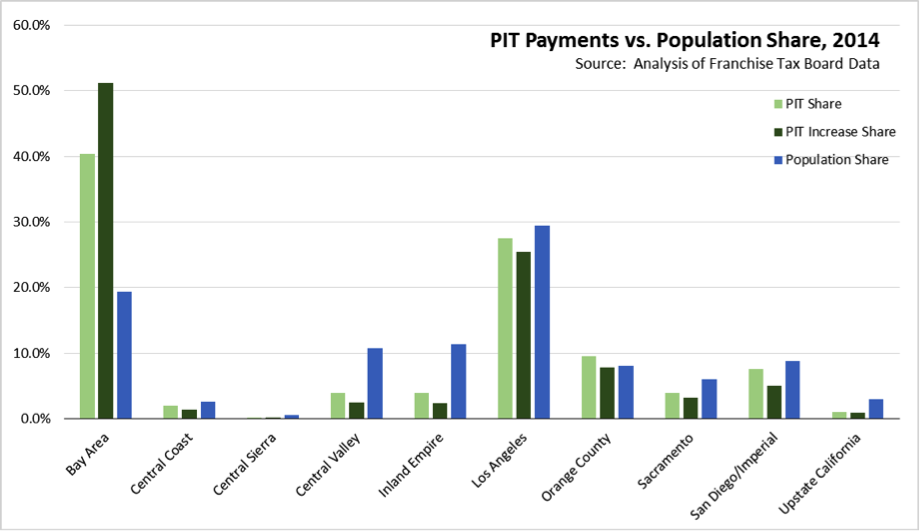
In the absence of state policies that promote more balanced and geographically dispersed jobs growth, California’s finances will likely continue to be reliant on the economic health of one region.
Who Else Pays to Support the State Budget?
Personal Income Tax (PIT) is the largest revenue source to the state budget, comprising in 2015-16 an estimated 49.7% of all state-generated revenues (General and Special Funds), and 67.0% of all General Fund revenues. The increasing volatility of the PIT structure combined with major new spending commitments beginning in 1999 and continuing through subsequent high revenue years led to the budget instability the state has faced through much of the last 15 years. Two recessions in this period led to marked budget deficits, causing the state to seek new revenue sources.
The primary focus in this regard has been the temporary PIT increase authorized by voter approval of Proposition 30. But Prop. 30 has not been the only revenue generator nor the largest.
The primary focus of the budget debates has been on the General Fund, but this component now represents less than half of total state expenditures. From 1978-79 to the current budget year, General Fund spending dropped from 87% to an estimated 71% of total General and Special Fund expenditures. Factoring in Bond and Federal Funds, General Fund went from 62% to 43%.
Special Fund revenues have grown rapidly over the past 15 years, both as a result of shifting programs formerly supported by General Funds to Special Funds and increasing reliance on new Special Fund revenues to support new programs in years—i.e., generally always—when the General Fund is oversubscribed. Special Funds also differ in nature in that many are set by the administrative agencies with comparatively less and sometimes no oversight by the Legislature or voters. For example, application of Cap and Trade to transportation fuels was decided at the administrative level by California Air Resources Board, an action that the LAO recently estimated now charges motorists an extra 11 cents per gallon at the pump.
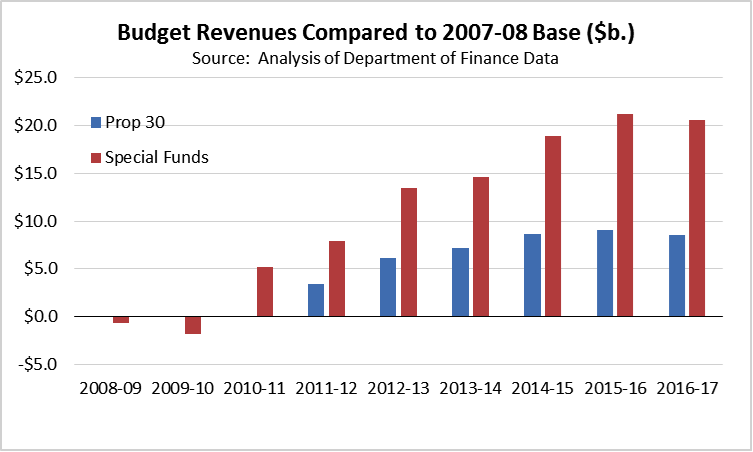
Along with Prop. 30, Special Fund revenue increases—composed of fees, dedicated taxes, and other revenue sources—have played an increasing role in the annual Budget. As illustrated in the chart showing the growth of revenues compared to the 2007-08 base, Special Fund increases were applied a year earlier than the Prop. 30 temporary tax increase, and at their estimated peak in the current budget year provide 2.3 times the revenue bump.
Note: All data sources, methodologies, and historical data series available at CenterforJobs.org.